How Far a $100 Grocery Budget Goes in Every State

With many grocery prices still higher than they were a year ago, shoppers are looking for every possible way to stretch their food budgets — whether that means breaking costly habits, choosing store brands, skipping pricey splurges, or stocking up when something is on sale.
But there’s another factor that can make a surprisingly big difference at checkout: where you live.
A $100 grocery budget doesn’t have the same buying power everywhere in the U.S. Depending on the state, that same $100 can have the purchasing power of more than $108 worth of groceries — or less than $80. So where does your grocery money go the furthest, and where does it disappear the fastest?
The $100 Grocery Budget Sweet Spot
According to a GOBankingRates analysis of grocery costs across the country, Arkansas is the best state for stretching a $100 grocery budget. That $100 has an average value of $108.34 when compared with national grocery costs.
Mississippi and North Dakota tie for second at $106.04, followed by Texas at $105.71 and Oklahoma at $105.60.
Another recent analysis backs up the broader trend.
Visual Capitalist, using first-quarter 2026 data from the Missouri Economic Research and Information Center (MERIC), found that Mississippi has the lowest grocery costs in the country, at 6.8% below the national average. Arkansas also ranks near the bottom at 6.6% below average.
The MERIC data measures the cost of a fixed basket of supermarket goods, with 100 representing the national average. It paints a particularly clear picture of the regional divide: Many Southern and Plains states fall below the national average, while grocery costs tend to be higher across much of the West Coast and Northeast.
That means the GOBankingRates results aren’t simply a quirk of one calculation. Different measures of grocery costs point to the same basic conclusion: Your grocery dollars tend to go further in parts of the South and Plains.

Reader Favorites



Here’s a look at the 10 states where a $100 grocery budget goes furthest, according to GOBankingRates:
| Ranking | State | Value of $100 |
| 1 | Arkansas | $108.34 |
| 2 | Mississippi | $106.04 |
| 3 | North Dakota | $106.04 |
| 4 | Texas | $105.71 |
| 5 | Oklahoma | $105.60 |
| 6 | Missouri | $105.04 |
| 7 | Kansas | $104.71 |
| 8 | Utah | $104.49 |
| 9 | Louisiana | $104.28 |
| 10 | West Virginia | $104.06 |
The numbers also illustrate how grocery affordability doesn’t always align with a state’s overall cost of living.
Take Utah, which ranks among the 10 states where $100 goes the furthest at the grocery store.Its annual cost of living is $57,171 — nearly $20,000 more than Kansas, which ranks just one spot ahead of Utah for grocery affordability. Yet a basket of groceries that costs $100 nationally would cost $95.50 in Kansas and $95.70 in Utah, for a difference of just 20 cents. West Virginia, meanwhile, has the lowest annual cost of living among the states in the top 10, yet comes in at No. 10 for grocery affordability.
The other big takeaway? You don’t have to live in the state with the lowest overall cost of living to get a relatively good deal on groceries.

The States Where $100 Doesn’t Go as Far
At the other end of the spectrum, grocery shoppers in several Western and Northeastern states have considerably less purchasing power.
Hawaii comes in dead last. A $100 grocery budget there has an average value of just $76.63 compared with the national average. Alaska isn’t far behind at $80.39.
Vermont, California, Maryland, and Connecticut also rank among the states where grocery shoppers get the least for their money.
Here’s a look at the 10 lowest-ranked states:
| Rank | State | Value of $100 |
| 41 | Rhode Island | $94.70 |
| 42 | Florida | $94.61 |
| 43 | Washington | $93.90 |
| 44 | Oregon | $93.72 |
| 45 | Connecticut | $93.46 |
| 46 | Maryland | $93.46 |
| 47 | California | $93.02 |
| 48 | Vermont | $92.94 |
| 49 | Alaska | $80.39 |
| 50 | Hawaii | $76.63 |
The difference between No. 1 Arkansas and No. 50 Hawaii is enormous: $100 in Arkansas has the purchasing power of $108.34 worth of groceries at the national average, compared with just $76.63 in Hawaii.
That’s a difference of $31.71 in purchasing power for every $100 spent.
In other words, a shopper spending $500 on groceries could theoretically face a purchasing power difference of nearly $159 depending on which two states they’re shopping in.

Hawaii Is in a Grocery Cost League of Its Own
Hawaii isn’t just the most expensive state for groceries — it’s also a major outlier.
According to the MERIC data analyzed by Visual Capitalist, Hawaii’s grocery cost index is 136.3, meaning its fixed basket of supermarket goods costs 36.3% more than the national average. Alaska comes in second at 126.6.
After that, there’s a pretty dramatic drop: California ranks third at 110.5, meaning groceries there are 10.5% above the national average, less than half Hawaii’s premium.
The geographic challenges facing Hawaii and Alaska help explain part of the gap. Much of the food sold in both states has to travel long distances by ship, barge, or air before reaching grocery store shelves, adding transportation and distribution costs.
But geography isn’t the only factor. Visual Capitalist notes that store operating costs, including wages and commercial real estate, can also influence grocery prices. That’s one reason some expensive coastal states have above-average grocery costs even when they’re relatively close to major food-producing regions.
Meat, Produce, and Other Grocery Staples Add Up
Where you live doesn’t affect every grocery category in exactly the same way, but the differences can add up quickly. Across the country, Americans spend at least $1,305 a year on meat, poultry, fish, and eggs, according to GOBankingRate’s analysis. In Hawaii, that figure rises to about $1,845.
Produce can also take a significant bite out of a grocery budget. Annual spending on fruits and vegetables tops $1,000 in several states, reaching approximately $1,244 in Hawaii and $1,186 in Alaska. Meanwhile, Arkansas shoppers spend an estimated $880 a year on fruits and vegetables, which is one reason the state’s overall grocery purchasing power is considerably stronger.
These numbers don’t mean that shoppers in expensive states are doing anything wrong — the same groceries simply cost more in some places.
Where Does Your State Rank?
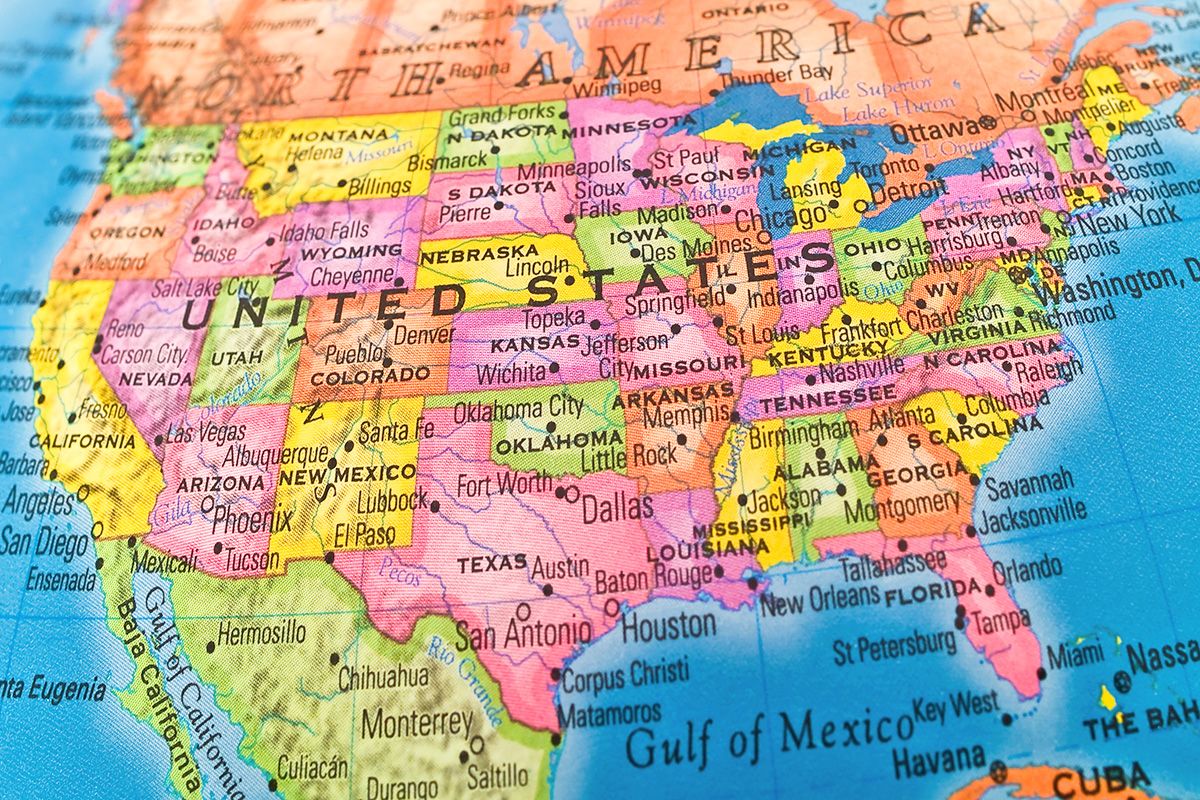
For shoppers wondering where their state falls, the broader ranking shows a fairly clear pattern: Southern and Midwestern states tend to offer more grocery purchasing power, while several Western and Northeastern states rank toward the bottom.
New York, for example, comes in at No. 38, with $100 in grocery spending having an average value of $96.62. New Jersey ranks No. 40 at $95.79. That means a New York shopper’s $100 grocery budget has somewhat less purchasing power than the national average, while someone in Arkansas gets considerably more.
And the differences don’t necessarily correspond with what you might expect based solely on a state’s reputation for being expensive or affordable. Grocery costs are just one piece of the broader cost-of-living puzzle.
How the Numbers Were Calculated
The figures come from a GOBankingRates analysis using data from the 2024 Bureau of Labor Statistics Consumer Expenditure Survey, along with state grocery cost-of-living indexes and other data sources.
GOBankingRates used the grocery cost-of-living index for each state to calculate the estimated cost of various grocery expenditures and then determined what a $100 grocery budget would be worth relative to the national average.
So the figures don’t mean that an identical shopping cart literally costs $108.34 in Arkansas and $76.63 in Hawaii. Rather, they represent the relative purchasing power of $100 in groceries based on each state’s grocery costs.
And while shoppers can’t exactly choose their state based on the price of a gallon of milk or a basket of apples, knowing where grocery costs tend to be higher can put your own food budget into perspective. Because when you’re trying to make $100 last at the grocery store, where you spend it matters almost as much as how you spend it.
Featured Image Credit: © Drazen/stock.adobe.com
More From Our Network
Better Report is part of Inbox Studio, an email-first media company. *Indicates a third-party property.






Jennifer M. Wood has been writing about news, entertainment, culture, and travel for longer than she cares to admit. She lives just outside Philadelphia with her husband and an ever-growing menagerie of rescue pets.
This article is for general informational purposes only.
Affiliate Disclaimer Medical Disclaimer Financial Disclaimer